A spend picture you can actually rely on
Data collected, cleansed and classified by a named team in India and the Middle East.

What is spend analysis?
Collecting your spend data from every system that holds it, cleaning it, classifying every transaction to a category structure, and turning the result into something you can act on. It is the work that has to happen before anyone can tell you where the savings are.
A word about evidence first, because this category deserves it. Nearly every spend analysis page you will read quotes a savings percentage. We could not find independent research behind any of them. The most recent public benchmarking we could trace on spend visibility is Ardent Partners work from 2017, and the vendor claims published since then are self-reported. So we are not going to tell you what percentage you will save. Anyone who does, before seeing your data, is guessing with confidence.
A savings percentage before we have seen your data. We will tell you what proportion of your spend we could classify, how much sits with suppliers you have no contract with, and where the addressable opportunities are. What you recover from that depends on decisions you make afterwards, not on us.
What those 2017 figures did show is worth understanding, because it is counter-intuitive. Best-in-Class organisations reported annual savings of 6.3 percent against 6.1 percent for everyone else, which is barely a difference. The gap was not in how well they negotiated. It was in how much spend they could actually reach: 56 percent under management against 39 percent, and 44 percent more of addressable spend actually sourced. Visibility does not make you better at saving. It makes more of your spend available to save on.
The work itself is unglamorous and mostly about data quality. Transactions arrive from your ERP, your card programme and your accounts payable system in different shapes, with supplier names spelled four ways, and a general ledger code that tells you it was an expense but not what was bought. Somebody has to reconcile that into one picture and classify it consistently. Doing that once is a project. Doing it every quarter so the picture stays current is a service.
Where we deliver
The regions we sell into, and the rules that govern each engagement.
- Australia and New Zealand
Our day overlaps ANZ mornings. Australian Privacy Principles govern cross border handling of transaction data.
- Canada
PIPEDA, and Law 25 in Quebec. Bilingual EN/FR supplier name normalisation where needed.
- United Kingdom
UK GDPR, with an IDTA covering transfers to India.
- GCC, UAE and Saudi Arabia
Our Middle East team gives local hours cover. Arabic supplier name handling, VAT treatment and data residency in the DPA.
- United States
Committed overlap hours in the contract, not best efforts. SOC 2 Type II is on our certification roadmap.
- Europe
GDPR first, with multi-currency and multi-language supplier normalisation. Strongest fit today in the Netherlands, the Nordics and Ireland.
What the team actually does
Five areas of work, handled end to end by the analysts assigned to your account.
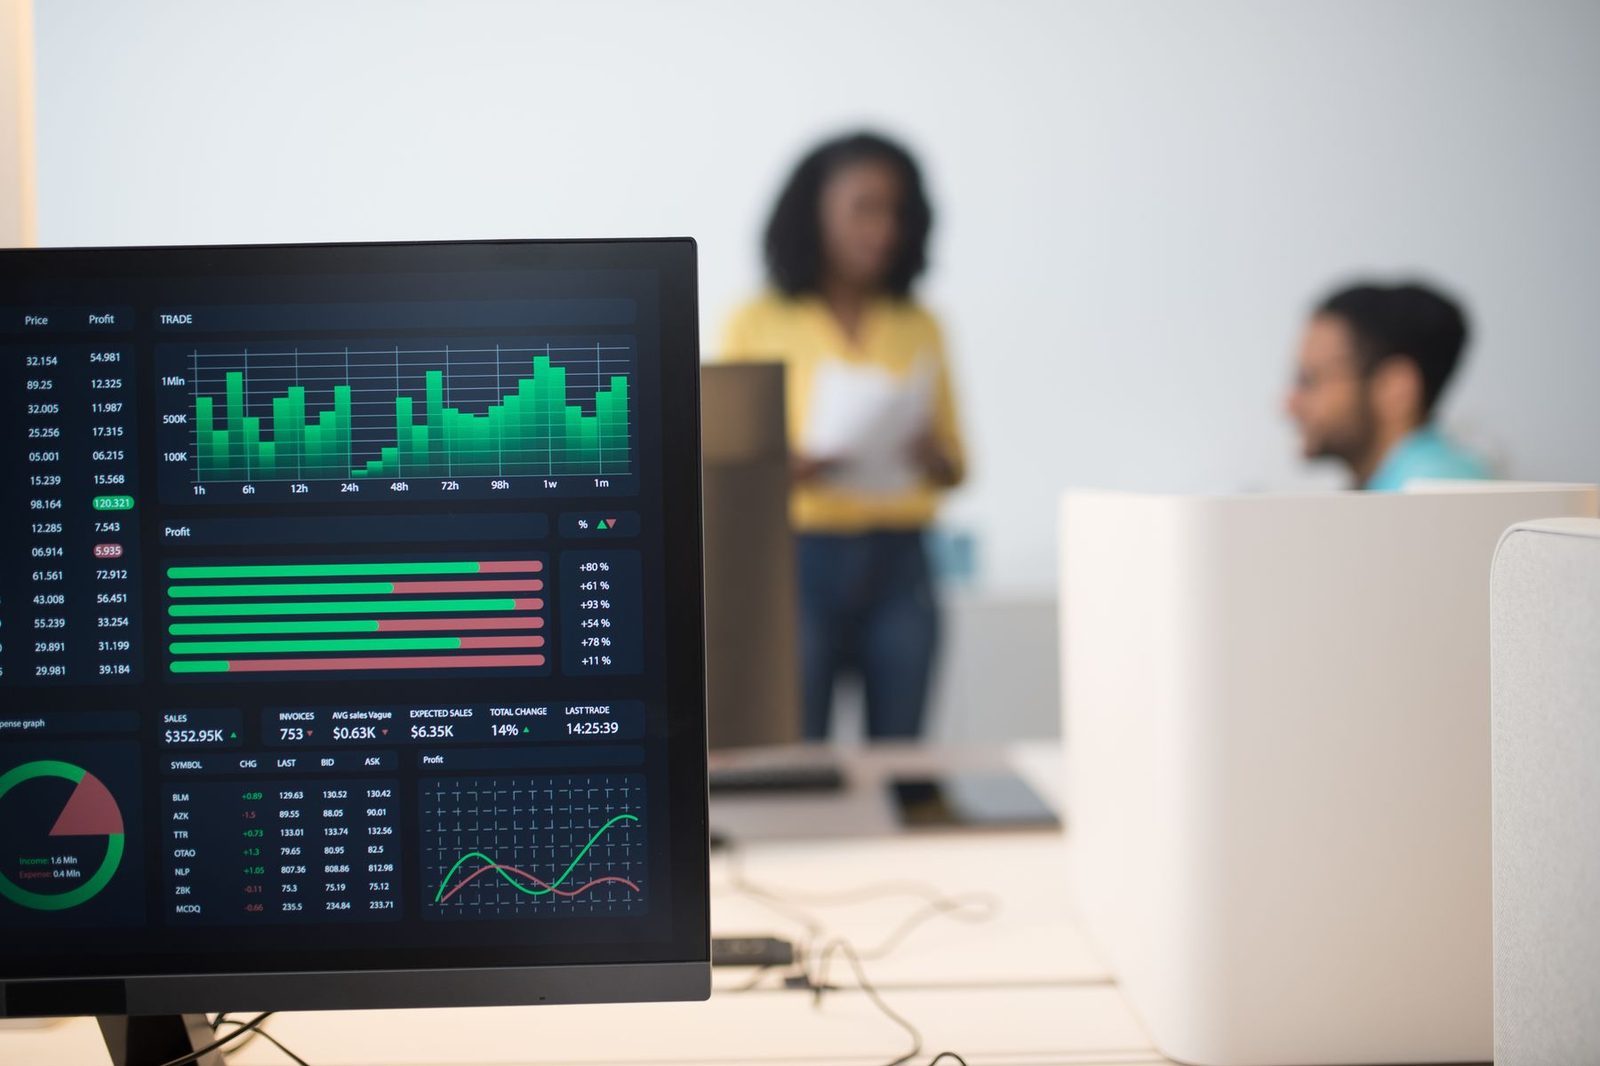
Every source that holds spend, pulled together into one reconciled set: ERP, card programmes and accounts payable.

The slow part. Four spellings of the same supplier become one, and parent companies get linked to their subsidiaries.

Every transaction placed in a category structure you approved, whether that is UNSPSC, your own, or a hybrid of both.
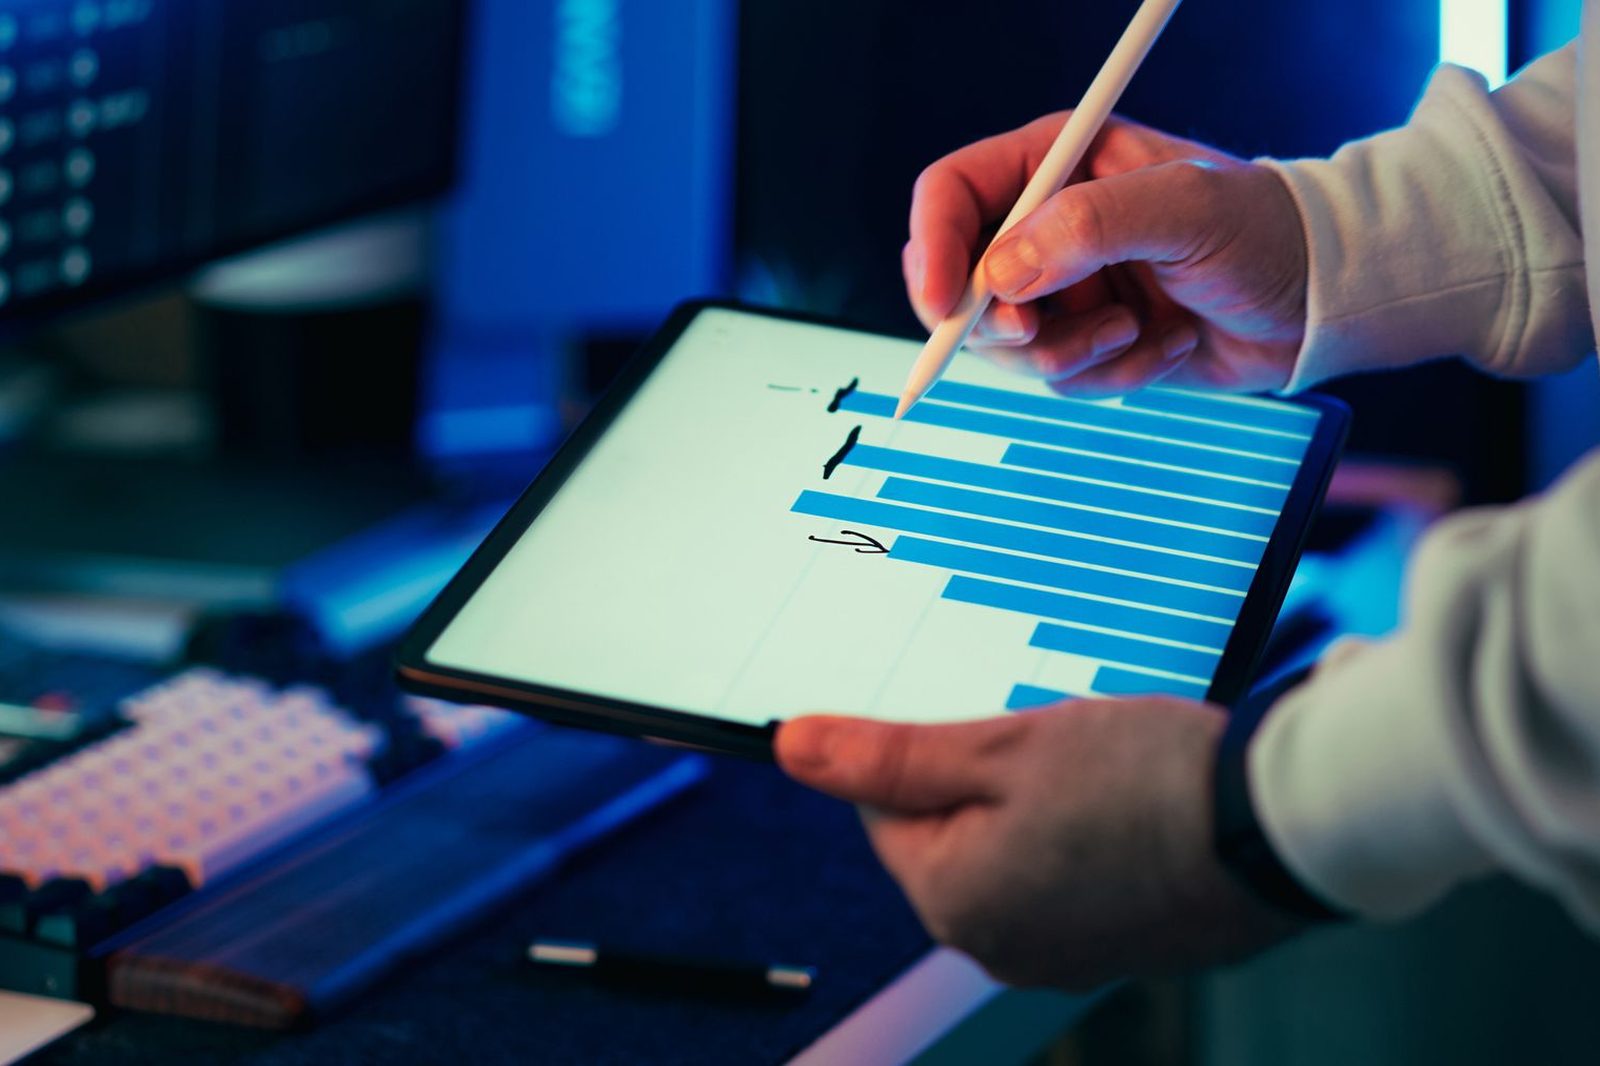
Spend by category, supplier and business unit, with the concentration and contract coverage that follows from it.

A refresh on your chosen cycle, so the picture does not go stale the month after you paid for it.
What we need from you
Four things. A finance analyst can usually produce them in under an hour.

Twelve months of transaction data, so we can classify a slice of it free and show you the accuracy.

One person on your side who can approve the category structure before we classify anything.

Read access to your reporting, or a scheduled extract. We do not need write access to anything.

The category structure, how deep it goes and who resolves the edge cases, agreed once before classification starts.
How we get you a picture you can trust
We classify a sample of your real data free of charge first, so you can judge the accuracy before paying for anything.
Send us a slice of your transaction data. We classify it, show you our working, and tell you honestly what proportion we could categorise with confidence and what needed a judgement call.
The full analysis: data collected from every source, cleansed, supplier names normalised, everything classified to a taxonomy you approved, with the opportunity assessment that comes out of it.
A refresh on the cycle you choose, so the picture does not go stale the month after you paid for it. New suppliers and new categories get classified as they appear.
Do it yourself, Procuriva, or buy a spend tool
The three routes to a spend picture. If you have clean data and an analyst with time, do it yourself. That is genuinely cheaper and we will say so.
Frequently asked questions
The questions procurement and finance teams ask before a spend analysis engagement starts.




See our accuracy on your own data. Free.
Send a slice of real data. We classify it and show our working, either way.